 Following the Smart Money -The Six (6) Indicators
Traders who can recognize and follow the movements of smart money can improve significantly their trading performance.
What is the Smart Money?
Smart money can be defined as the capital invested by traders with expert knowledge and often with inside information. Smart money can spot trends before others and trades basically against the general market sentiment.
Smart Money and the Foreign Exchange Market
The Foreign Exchange market is a decentralized (OTC) market and that means there is no track record of the aggregate trading activity. That makes things even more difficult to identify the smart money movements. However, there are quite a few indicators providing insight into where the smart money is flowing.
This analysis includes the following indicators:
- Following the Long-Term Circles of Unemployment, Inflation, and Growth
- COT Analysis (Commitment of traders)
- The US-Dollar Index (USDX)
- The CBOE Volatility Indexes (VIX & Skew Index)
- The Treasury Bills Correlations
- Contrarian-News Approach

(1) Following the Long-Term Circles of Unemployment, Inflation, and Growth
When trading in any financial market the key economic indicators (inflation, growth, and unemployment) are the determinants of the long-term economic circle. These three key indicators can be used also as a predictor of upcoming changes in the level of interest rates.
The Importance of Unemployment Changes in the Forex Market
From all macroeconomic indicators, the level of unemployment has proved the most accurate indicator for predicting shifts in the long-term trends of currency pairs.
Using Economic Data to Form Growth Patterns
Most retail traders see key economic releases as static information and miss the existence of a specific pattern. Smart money, on the other hand, treats the release of any economic data as a piece of information essential to forming a long-term economic pattern. This pattern will be used as a tool for:
(i) Forecasting the long-term market sentiment
(ii) Forecasting the long-term trends of currency pairs
(2) The COT Analysis (Commitment of traders)
The COT (Commitment of Traders) is a weekly report by the CFTC that presents the aggregate short and long trading positions in the Futures Market (US). This report includes the positions of different market participants in all major asset classes, including Forex pairs. The COT report refers to the aggregate positions of:
(i) Commercial Traders
(ii) Non-Commercial Traders
(iii) Small Speculators
The important information included in the COT report is the aggregate positions of Non-Commercial Traders (hedge funds, large speculators, investment banks, etc.). Significant changes in the positions of Non-Commercial traders may indicate upcoming trend reversals in the Spot Market.
► CFTC -Commitments of Traders | ► CME Forex Futures COT
(3) The US-Dollar Index (USDX, DXY)
The US Dollar Index is a measure of the value of the US Dollar relative to a basket of foreign currencies.
The US Dollar Index started in 1973 with a base of 100. That means that if the USDX is found at 300 it has performed 200% against a basket of six (6) major Forex currencies.
Table: USDX and the Basket of Six Currencies
|
FOREIGN CURRENCY |
SYMBOL |
WEIGHT |
|
(1) European Euro |
EUR |
57.60% |
|
(2) Japanese Yen |
JPY |
13.60% |
|
(3) British Sterling |
GBP |
11.90% |
|
(4) Canadian Dollar |
CAD |
9.10% |
|
(5) Swedish Krona |
SEK |
4.20% |
|
(6) Swiss Franc |
CHF |
3.60% |
|
|
TOTAL |
100% |
Using USDX as an Indicator for all Dollar-Based Currency Pairs
Most retail traders anticipate that EURUSD is the most important indicator of what happens next regarding all the dollar-based currency pairs. That may be true to an extent, as EURUSD is correlated +0.8 to GBPUSD, and highly correlated to AUDUSD and NZDUSD as well. But there is an even better indicator for predicting the trend of a dollar-based pair, and that is the US dollar index. When the USDX trends well it is almost sure that the US Dollar will move against all Forex Majors. Therefore, performing constant technical analysis on the USDX chart is a key process for smart money. The USDX Futures are traded on the Intercontinental Exchange, the symbol is DX.
(4) Forecasting Market Volatility using the CBOE Volatility Indexes (VIX & Skew Index)
- Options volatility indexes such as the CBOE Volatility Index (^VIX) and the CBOE Skew Index (^SKEW) are used in forecasting future market volatility and market sentiment.
- The analysis of such volatility measures assists smart money in managing and diversifying portfolios more effectively.
- The Role of Options Volatility as a Forecasting Tool
The price of call & put options can be used as a measure of implied volatility, as volatility is one of the pricing factors of all options contracts. These are the three key pricing factors of an options contract:
- Intrinsic Value
- Time-to-Maturity
- Volatility
Any volatility modification of the underlying instrument makes an option contract more (or less) valuable, as there is a greater (or smaller) probability that the option may expire in-the-money, at the end of its maturity.
■ The Greater the Options Volatility → the Greater the Option Price
Therefore, other things being equal, a higher option price forecasts greater volatility.
(i) The CBOE Volatility Index(^VIX)
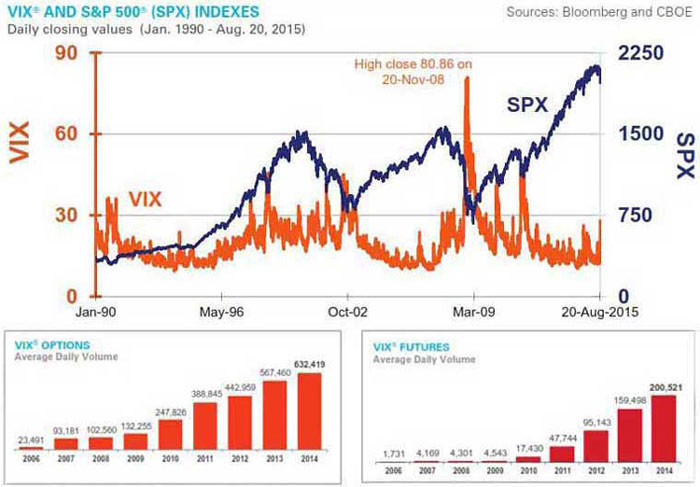
The CBOE Volatility Index (VIX) is considered the most important barometer of equity market volatility. The VIX Index is based on S&P 500 options contracts. It is designed to reflect investors' consensus view of 30-day expected stock market volatility.
(ii) The CBOE Skew Index (^SKEW)
CBOE Skew index measures the implied volatility of deep out-of-the-money options.
What are Deep Out-of-the-Money Options?
Deep out-of-the-money options are contracts that will almost surely lose money {there is a great difference between the Current Price and the Price of Execution of the Underlying Instrument}. For example, an options contract to buy USOIL at $80 at the end of the month, while now it is trading at $70.
Using the CBOE Skew Index
The CBOE Skew IndexSM or "SKEW" – is an option-based indicator that measures the perceived tail risk of the distribution of S&P 500 log-returns at a 30-day horizon.
The CBOE Skew index works as a measure of panic. As concerns S&P500, there have been 15 times in the past when the CBOE Skew index readings moved above 140, during the period 1990-2015. An increase in the Skew Index spikes means an increase in the cost of hedging against risk. The cost of hedging against market risk is a very important issue for smart money.
Chart: VIX and S&P 500

The Volatility Index (VIX): » www.cboe.com/VIX | The Skew Index: » www.cboe.com/Skew
(5) The Treasury Bills Correlation to the Forex and Equity Markets
Significant changes in the yields of government bonds are a predictor of significant upcoming economic transitions. In addition, changes in the spread between different maturity bonds may forecast what is about to happen in the Financial Markets.
Smart money keeps always a close eye on the bond markets and the spread between the yields of T-Bills.
The Effect of T-Bills on Equity and Forex Markets
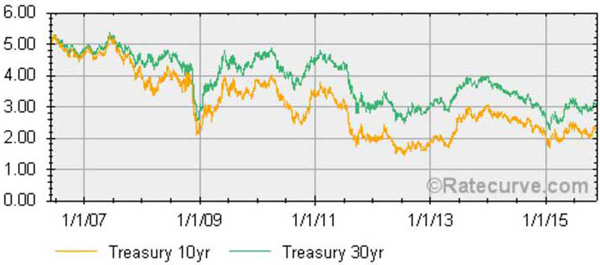
Global financial markets operate as a common area for investment, incorporating several different combinations of Risk/Return. This means that an important price shift in one market affects the combination of risk and return in all the other financial markets. In 2007, as the stock market was booming, the US 10-year bond yield exceeded 5%. On the contrary, in 2008, as the stock market crashed, the yield of the same US bond dropped close to 2%.
The Spread Difference
As a general rule, the longer-maturity bond should pay a higher yield than a shorter-maturity bond. By measuring the spread between two different maturity bonds, smart money can come to some serious conclusions regarding where the economy is heading. These are the four (4) basic scenarios:
- If the 30-year US bond yield is considerably higher than the 10-year bond yield, the smart money anticipates better economic conditions in the long run
- If the 10-year and 30-year bond yields are almost identical, the smart money anticipates that the economy is entering a transition stage
- If the 10-year Bond yield drops considerably faster than the 30-year Bond yield, the smart money expects bad mid-term economic conditions
- If the 10-year bond yield is considerably higher than the 30-year bond yield, the smart money anticipates a future economic recession
Chart: The 30-Year and 10-Year T-bill Yields

(6) Contrarian-News Market Approach
Last but not least, is an empirical indicator that has proved highly reliable throughout the years.
When key news is released and the market goes the other way it should, then there is an 80% probability that the market will continue in that contrarian direction. When the market trades against the news it is an indicator that the smart money buys or sells aggressively in the opposite direction of the news.
This is a common situation when trading shares. Let's see an example:
- A company has beaten its earnings estimates by 5% for the 2nd quarter
- As the market opens, the good news is released and intraday speculators are buying aggressively as they anticipate a strong move is on the way
- The share of that company moves slightly up for the first few minutes (demand>supply), followed by increased volume activity
- Suddenly the volume activity booms and the share price retraces to the levels before the news release (supply>demand)
- At this point, there is an 80% probability that this share will continue falling
- The simple explanation is that the smart money got in before the news and waited for this news release to unload tons of shares
-Now, as the majority of speculators will realize that this share will not move any higher they will try to get out immediately. In other words, blood is about to get spilled on the trading floor.
-The same contrarian-news trading approach can be applied in any other market, including the Foreign Exchange Market.
Final Thoughts on Smart Money
No matter how good you can become at reading the above six indicators don't forget to add a little bit of contrarian flavor to your decision-making. Smart money tends to move the opposite way than the general market sentiment. The greatest trading opportunities in life are always against the general market sentiment.
■ Following the Smart Money
George Protonotarios, Financial Analyst
for CurrenciesFx (c)
> READ MORE ON RESEARCH

