 Forex Institutional Trading, Order Flows, and Stop-Hunts
If you are a retail trader, understanding the role of Institutional Trading is the same as a little Penguin knows when and where the white sharks go for hunting. This little information can save its life numerous times.
Profiling Institutional Traders
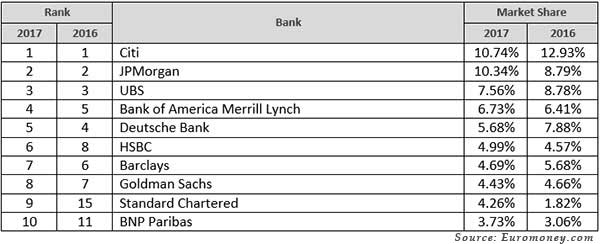
Institutional traders are large players managing great sums of trading capital. They include Investment Banks, Hedge Funds, Mutual Funds, Investment Firms, and some large Commercial Corporations. Institutional traders can manage their funds but also their clients’ funds. The Euromoney Survey can provide a good insight into the top institutional players in the Forex market.
The Euromoney Forex Survey
According to the 2017 Euromoney Foreign Exchange survey, Citigroup continues to hold the top ranking amongst currency trading companies. Note that the market share of the top five (5) global banks has diminished to 41.1% compared to 61.5% in 2009.
Table: Euromoney Fx Ranking (Based on Forex Market Volumes)

The Essence of Managing Portfolio Risk for Institutional Traders
Institutional traders are very risk-averse and avoid trading ‘naked’ in the market. They give extra weight to concepts such as risk management, portfolio diversification, and cross-asset correlations. They use every available financial instrument they can get in the market (Forwards, Futures, Options, Swaps, etc.). In addition, they care a lot about the transaction cost they pay. Institutional traders do not like placing all their eggs in the same basket. Therefore, they open many different positions in the market. Positions that they plan to hold for long periods. On the other hand, retail traders open a few positions and plan to hold them for short periods. The following table highlights the different trading philosophies of institutional and retail traders.
Table: Comparing Institutional Traders to Retail Traders
|
|
Institutional Trader |
Retail Trader |
|
Available Capital |
holding 2 Million USD to many Billions USD |
holding 6,600 USD on average (US average deposit) |
|
Positioning in the Market |
Many Large Positions |
A Few Small Positions |
|
Horizon |
Long-Term |
Short-Term |
|
Trading Chart |
No Specific Timeframe |
M5 to D1 |
|
Financial Instruments Used |
|
|
|
Main Analysis Framework |
|
|
|
Typical Leverage |
1:1 to 20:1 |
10:1 to 200:1 |
|
Risk Management |
|
|
If we take a close look at the above table, we will realize why institutional traders enjoy better long-term returns than retail traders. Their approach is to stay alive in the market for a long time, while retail traders focus simply on quick profits. Institutional traders are being cautious while retail traders are being greedy. That explains perfectly why the great majority of retail traders are losing money in the long run.
How the Institutional Traders Cope with the Market Dynamics
Institutional traders focus on three key aspects of trading:
(i) Fundamental changes, aiming to incorporate new market conditions if any
(ii) Demand and supply metrics, aiming to identify key trends
(iii) The order flow coming from their clients
The Role of Time
Institutional traders do not use a specific timeframe as they usually have a large flow of orders coming from their clients. Instead, they will focus on:
(i) Times of important news releases that may generate new fundamental conditions
(ii) London opening/closing

Institutional Traders and Technical Analysis
As mentioned above, institutional traders focus more on demand/supply metrics than on traditional technical analysis tools and techniques. Nevertheless, there are a few indicators worth mentioning:
(1) Market Momentum
The market momentum can indicate the continuation of a strong trend based on demand/supply. Identifying fundamental changes and following the market momentum in the early stages maximizes the odds of trading profitably.
(2) Historic Support & Resistance
It may indicate the participation of new buyers or new sellers. In general, these price levels include:
-
Key Previous Highs & Lows
-
Pivot points (Weekly, Monthly)
-
Round Numbers
-
Price Channels (on Weekly Charts)
(3) The 200-day moving average
Breaking upwards or downwards the 200-day SMA can prove a strong alert for a price reversal. Given, that this crossing meets the criteria of proper confirmation by time and price.
(4) VWAP - Volume Weighted Average Price
VWAP is a ratio used in equity trading measuring the value traded to the total volume traded over a particular timeframe -usually one day.
Institutional Traders' Order Flow
The Forex market is a 24/5 financial market consisting of four main sessions. There is no specific trading timeframe during the 24-hour clock, as any order can be executed at any time, from Monday to Friday. The 24-hour Forex market consists of the European, American, Pacific session, and the Asian session. This mechanism creates three main crossovers with overlaps. The crossovers consist: from Europe to the United States, from the United States to Asia, and finally, from Asia to Europe again.
|
Forex Session |
Market |
GMT Hours |
EST Hours |
|
London |
7.00 am to 4.00 pm |
3.00 am to 00.00 |
|
New York |
00.00 to 9.00 pm |
8.00 am to 5 pm |
|
Sydney |
9.00 pm to 6.00 am |
5.00 pm to 2 am |
|
Tokyo |
11.00 pm to 8.00 am |
7.00 pm to 4 am |
This four-session module creates a cycle of orders flowing from one market to another. By observing this order flow, institutional traders can measure where the demand/supply is building up. In addition, the flow of orders helps determine the demand/supply levels that may signal price exhaustion and potential reversal.
“As concerns institutional traders: It isn’t about time, it is about the demand/supply building a price level”
Example of how Institutional Traders can Profit from the Order Flow
Kathy Lien in her book “Day Trading the Currency Market: 2004” presents a perfect example of how institutions can profit by knowing the order flow. Here is an example:
The British Pound against the US Dollar becomes more active during the London trading hours, as the majority of GBP/USD trading orders are executed through British and other European market makers. According to Lien, the initial movement at the London opening may not always be the real one, as the British and other European dealers have tremendous insight into the extent of actual supply and demand for the pair. Interbank dealing desks survey their books at the onset of trading and use their client data to trigger close stops on both sides of the markets to gain the pip differential. Once these 'stops' are taken out and the books are cleared, the real directional move in the GBP/USD will begin to occur.
Order Flow with COT Report
The weekly COT report by the CFTC can provide additional insight regarding the directional bias of institutional traders. The COT report is available for all actively traded Futures contracts such as stock indices, interest rates, and currencies. The available market data consists of three (3) categories of market participants:
(1) Non-commercial traders / large speculators (that is the key information)
(2) Commercial Forex traders/hedgers
(3) Small speculators
Institutional Stop Hunts
Foreign Exchange is the most leveraged market worldwide. The Forex market’s huge liquidity and narrow spreads help retail currency traders to leverage their capital 100:1, or even more. The extreme degree of capital leverage pushes the stop-loss levels of retail traders very close to where the market is trading at the time they open a position. In other words, retail traders tend to accept enormous levels of market risk.
As most retail traders are intraday speculators using a high degree of leverage and narrow stop-losses, stop-hunting has evolved into a common practice for institutional traders. Large investment banks have a strong incentive to push the price beyond the stop-levels of their clients and other retail participants. When they can do it, they will do it without mercy. Anywise, the stop-hunt is a legitimate practice, given it does not lead to general market manipulation.
The phenomenon of stop-hunting exists in every leveraged market especially when large numbers of stop-loss orders are placed and active at particular price levels. After the hunt is over the market retraces to its original direction according to the dynamics of demand/supply.
How to Avoid Stop Hunts
-
Do not overtrade your positions to be able to place the proper stop-losses
-
Prefer to trade with ECN/STP brokers than with market makers. A dealing desk broker can initiate stop-hunting techniques at times of minor liquidity
-
Avoid using timeframes shorter than the H4 when you are planning your order setups
-
Start placing mental stops and stop placing the same stops as everybody else does
-
Think as a retail trader and generally do the opposite. The extreme majority of retail traders lose money, therefore, you need a contrarian approach to join the winning side
-
Avoid times of key news releases, because during these times stop-hunting becomes even more lucrative for institutional traders
-
If you trade close to key support/resistance levels note that certain conditions must be met before a breakout or a price reversal is confirmed properly. Without confirmation, your stops can become easy prey for stop-hunters
-
Do not place orders on round numbers (1.1500), not even very close to round numbers (you need at least 16-17 pips above or below)
False Breakouts
Price breakouts are often false and can be the outcome of a Stop Hunt. Retail traders tend to open risky positions when they think a key breakout has happened. As they are sure there is no turning back for the price, they apply extreme leverage on their trades and place a stop just below or above the breakout price. That is the ideal landscape for losing money. Most of the time, the market will retrace below the breakout level and retail traders will be stooped out at a glance. The key to a proper breakout is confirmation. A breakout needs confirmation by the price action and by time.
These are some tips:
1. Use the Right Timeframe
H1, H4, and D1 charts are more reliable for identifying breakouts than M5, M15, and M30 charts. A breakout in a 4-hour chart is much more trustworthy than a breakout in an M15 chart.
2. Seek Confirmation
The proper confirmation of a price breakout depends on the trading timeframe. On an H1 chart, you need at least 15 pips above the breakout level and at least one (1) close to the direction of the breakout. Many traders wait for three (3) closings above/below the breakout point before entering the market.
In addition, the peak of volatility is a good sign for a price breakout. When trading equities, the peak of trading volumes can confirm the potential of a breakout. In Forex trading there are no reliable volume data, therefore, volatility plays a role in volume activity.
In any case, you can never be 100% sure. Confirmation just offers better probabilities of winning.
3. Don’t Trust Forex Crosses
The Forex market action is driven by the major currency pairs (EURUSD, GBPUSD, USDJPY, USDCHF, USDCAD, AUDUSD, NZDUSD). A price breakout in these pairs is much more reliable than a breakout in a Forex Cross. For example, trading a breakout in GBPCAD is pointless, as the dynamics of GBPCAD are based on GBPUSD and USDCAD price action.
4. An Ideal Breakout will have a Fundamental Background
The existence of a key support/resistance level or the existence of a price channel is not a random event. There are fundamental reasons that explain the activation of strong demand and supply at certain levels. In order, for a key breakout to occur there should be a fundamental change explaining why the buyers or sellers failed to defend support or resistance.
■ Forex Institutional Traders and Order Flows
Giorgos Protonotarios for CurrenciesFx.com (c)
> READ MORE ON RESEARCH

