Understanding Intermarket Analysis 
Intermarket Analysis investigates the relationships between different financial markets. The following intermarket analysis focuses on four major asset classes: bonds, currencies, equities, and commodities.
INTERMARKET ANALYSIS GUIDE CONTENTS
The Unification of Global Financial Markets
World financial markets operate as a common area for world investors, a common area incorporating different combinations of Risk/Return, for example:
-
Government Bonds: Low Risk / Low Return
-
Corporate Bonds: Medium Risk / Medium Return
-
Hedge Funds: Medium Risk / Medium Return
-
Equity Markets: High Risk / High Return
Since the financial crisis of 2007, the interconnections between these different combinations of Risk/Return have grown stronger. What happens in one financial market affects directly what happens in all other markets.
The Goals of Intermarket Analysis
Modern analysts use sophisticated frameworks, which can incorporate the major market interconnections. This is crucial for the following reasons:
(i) Explaining price action, when other methods fail
(ii) Obtaining early insight into strong long-term trends
(iii) Performing more accurate forecasting on individual assets (short-term and mid-term)
(iv) Reducing the cross-market portfolio risk, which emerges from the existence of all these interconnections (a very important process for institutional investors)
Defining a Cross-Market Correlation
The term correlation will be widely used in this analysis. A correlation between two asset classes expresses an average relationship between two different markets, backed by historical data. The correlation coefficient takes values between -1.0 and +1.0, where:
-
+1.0 is the perfect cross-market correlation (identical direction between two assets or asset classes)
-
-1.0 is the perfect negative cross-market correlation (identical opposite direction between two assets or asset classes)
John Murphy Work
John Murphy in his classic book “Intermarket Analysis: 1991” supported that there are clear relationships between financial markets:
(i) Commodities and the US Dollar (strong negative correlation)
(ii) Equities and Bonds (usually positively correlated, in a normal inflationary environment)
(iii) Bonds and Commodities
He also supported that financial analysts can take advantage of Intermarket relationships to (a) identify the stage of the economic cycle, and (b) improve their forecasting abilities.
The Role of Inflation
According to Murphy, the Intermarket correlations depend on the changing forces of inflation and deflation.
Inflationary Environment
During a ‘normal’ inflationary environment, equities and bonds show a positive correlation. When the interest rate is falling: (a) bond prices go up, and (b) stocks react positively to falling interest rates. On the other hand, USD and commodities are negatively correlated.
-
Equities and Bonds → Positive Correlation
-
US Dollar and Commodities → Inverse Correlation
Deflationary Environment
During a deflationary environment, equities and bonds show an inverse correlation. This also means that equities will have a positive relationship with interest rates. Note that almost all other Intermarket relationships in a deflationary environment remain the same.
-
Equities and Bonds → Inverse Correlation
-
US Dollar and Commodities → Inverse Correlation
-
Commodities and Bonds → Inverse Correlation
-
Equities and Commodities → Positive Correlation
The Complicated Role of the US Dollar
The exchange rate of the US Dollar affects directly every single asset class in every global market. The US Dollar can be bullish or bearish for equity and bond prices, although, it is strongly bearish for commodity prices.
By comparing USDX (US Dollar Index) against Dow Jones industrial in the past 20 years, we get a correlation coefficient of around +0.35. That positive relation means that the US Dollar and DJIA move generally in the same direction. On the other hand, as the correlation coefficient is only 0.35, only 35% of all DJIA movements are linked to US Dollar movements.
Explaining the Adverse Correlation of USD to Commodity Prices
A rising US Dollar pushes commodity prices lower, simply because all key commodities are priced in Dollars. This is an example of silver. If the USD advances by 10%, and silver is priced in USD, to maintain the same levels of demand/supply for silver, the price of silver must decline by 10%. On the other hand, if the USD declines by 10%, silver must appreciate by 10% to sustain the same levels of demand/supply.
Theory Extensions
-If the US Dollar advances and commodity prices decline, the raw material costs for US companies decline too. That is good news for US industrial shares. On the other hand, a strong dollar makes exports more expensive, and that is bad news for US exporters.
-Bond prices benefit from a rising Dollar, as lower commodity prices reduce inflation and the need for higher interest rates.
-On rare occasions, when the US Dollar and Commodity prices advance simultaneously, both Bond and Equity prices will suffer losses.
Trading the Cross-Market Relationships
The process of understanding the relationships between different markets can provide an early insight into long-term trends. These are some key Cross-Market Relationships.
US Dollar and Gold Price Adverse Relation
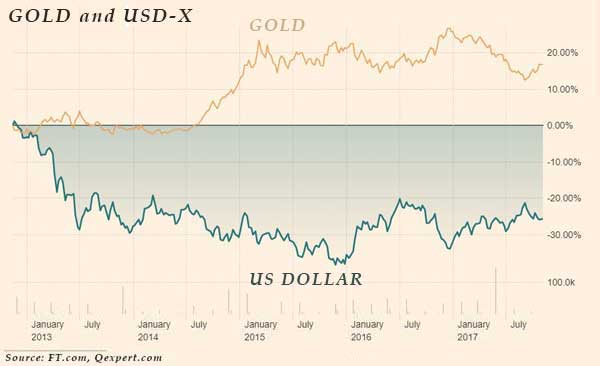
Statistics suggest that there is a negative correlation of -0.90 between the US Dollar Index (USDX) and Gold. The value -0.90 means almost an identical adverse relation.
On the other hand, Gold is highly correlated (+0.8) to the Australian Dollar (AUD). Australia is the third-largest gold producer in the world (9.4% of global production), holding 9,800 tonnes of Gold reserves (18% of global reserves).
■ The USD/Gold negative correlation is about -0.90
■ AUDUSD has shown about +0.80 positive correlation to Gold
Occasionally, investors can take advantage of these two cross-market correlations and trade AUDUSD instead of Gold.
► Read about AUDUSD and Gold relationship
Chart: Gold Price and the US Dollar Index

Energies are very important commodities for the world economy as in general they drive inflation and affect economic growth. Oil and Natural Gas are the two key energy assets for the global economy.
A significant advance in oil prices can be very bad news for equities and bonds, but also for the currencies of countries that import large quantities of oil. Japan is a great oil importer, and therefore, the Japanese Yen is negatively correlated to oil prices.
On the other hand, currencies of oil-exporting countries, such as the Canadian Dollar, The Norwegian Krone, and the Russian Rubble, are positively correlated to oil prices.
■ USDCAD has shown a 0.75-0.80 negative correlation to the price of Crude Oil
These are some key relationships for Oil:
-
The US Dollar Index (Oil is priced in USD)
-
USD/CAD, USD/RUB, and NOK/USD (all three countries are large oil exporters)
-
USDJPY (Japan is a large oil importer)
-
Global macroeconomic cycle (affecting demand/supply for oil)
-
Demand from China
-
US Equity Markets
-
Political conditions in the Middle East
-
Weather Forecast / Natural Disasters
EURUSD is by far the most traded financial asset in the world. These are some key EUR/USD relationships:
-
British pound (strong positive correlation to GBPUSD)
-
Swiss Franc (strong adverse correlation to USDCHF)
-
Gold Price (strong positive correlation)
-
Australian Dollar (strong positive correlation)
-
Japanese Yen (adverse correlation to USDJPY)
-
Nasdaq 100 Index
USDJPY Correlation to Equity Prices
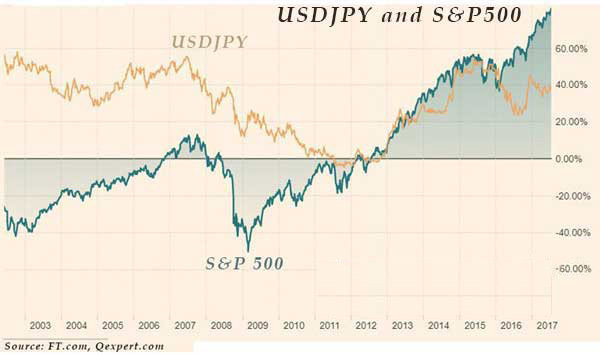
There is a strong positive correlation between USDJPY and equity prices, and there is a very good reason for that. When investors buy US equities (stocks, equity funds, etc.) tend to borrow money in low-interest-rate currencies. One of the safest low-interest currencies in the world is the Japanese Yen (JPY). This is an example of how this process works:
Stage-(1): As investors get bullish on US equities, they borrow money to buy stocks. They borrow money in the Japanese Yen, to take advantage of a low interest rate. After they borrow funds in Yen, they change that money to US Dollars and buy US stocks. Therefore, they buy US Dollars today and must repay Yens in the future. If a great number of investors do that transaction simultaneously, USDJPY will advance considerably higher.
Stage-(2): The investors now feel bearish on US equities, so they sell stocks. They are selling the stocks they bought before in US Dollars and paying back the money they have borrowed in Japanese Yen. Therefore, they exchange US Dollars to pay back Yens. That transaction will push USDJPY lower.
Note, that the existence of financial arbitrage accelerates the above process and creates a direct correlation between USDJPY and American stocks.
Chart: USDJPY and S&P500

► Read more about S&P500 and USDJPY correlation
Key USDJPY Relationships
Forex traders need to take into account the following USDJPY relations:
-
S&P 500 Index
-
Nikkei 225 Index
-
US Treasury Notes (2-year and 5-year Notes)
-
EUR/USD (adverse correlation)
-
EUR/JPY (strong positive correlation)
-
Crude Oil Price (Japan is a major Crude Oil Importer)
Treasury Bills Correlation to the Forex and Equity Markets
Significant changes in the yields of government bonds are a predictor of significant upcoming economic transitions. In addition, changes in the spread between different maturity bonds may forecast what is about to happen in the Financial Markets.
The 10-Year and 30-Year T-Bills Spread Difference
In general, the longer-maturity bond should pay a higher yield than a shorter-maturity bond. By measuring the spread between two different maturity bonds, there are four (4) basic scenarios regarding global economic conditions:
-
If the 30-year US bond yield is considerably higher than the 10-year bond yield, it is a sign of better economic conditions in the long run
-
If the 10-year and 30-year bond yields are almost identical, it is a sign that the economy is entering a transition stage
-
If the 10-year Bond yield drops considerably faster than the 30-year Bond yield, it is a sign of bad mid-term economic conditions
-
If the 10-year bond yield is considerably higher than the 30-year bond yield, it is a sign of future economic recession
► Read more about Smart Money and how to follow it
Industrial Metals Correlation to Equity Prices
The advance in the price of energy commodities or Gold can be due to pure economic conditions (higher demand) or due to other, non-economic, conditions. For example, energy prices can advance due to political unrest in the Middle East. Therefore, there cannot be a direct relation between Energy Prices or Gold and global economic conditions.
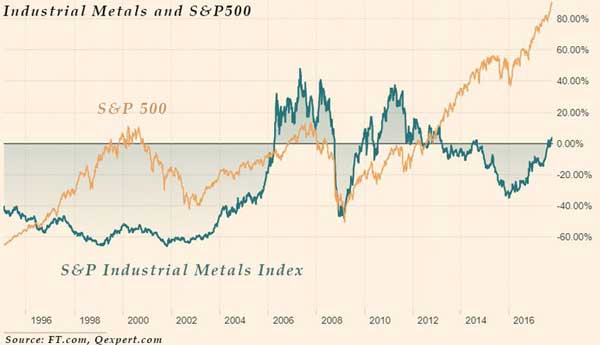
On the other hand, an advance or decline in the price of industrial metals is due to purely economic conditions. The prices of industrial metals tend to move in the same direction as the stock market. If the prices of industrial metals advance, it is a sign of increasing demand and a growing economy. If the prices of industrial metals decline, it is a sign of a weak economy.
Chart: Relationship between the S&P500 and the S&P GSCI Industrial Metals Index

Changes in the prices of Industrial Metals work as an indicator measuring the overall strength of the economy, and consequently, a forecasting indicator for equity and bond prices.
Research-Based on 15.5 Years of Daily Market Data
Using daily trading data for the period starting in January 2002 and ending in September 2017, these are the average monthly returns of the US Dollar Index, Gold, Dow30, and Sweet Crude Oil.
Table: Averaging Monthly Returns for USDX, Gold, Dow30, and Crude Oil
|
CALENDAR |
USD-X |
GOLD |
DOW-30 |
CRUDE OIL |
|
JANUARY |
0.58% |
3.07% |
-1.29% |
0.37% |
|
FEBRUARY |
0.00% |
1.47% |
0.61% |
4.74% |
|
MARCH |
-0.31% |
-0.36% |
1.44% |
2.28% |
|
APRIL |
-1.06% |
0.89% |
1.15% |
3.16% |
|
MAY |
0.51% |
-0.05% |
0.76% |
2.15% |
|
JUNE |
-0.47% |
-0.56% |
-1.40% |
1.93% |
|
JULY |
-0.21% |
0.61% |
1.11% |
-0.31% |
|
AUGUST |
0.27% |
2.15% |
-0.44% |
1.37% |
|
SEPTEMBER |
-0.36% |
0.94% |
-0.29% |
-2.02% |
|
OCTOBER |
0.10% |
-0.08% |
1.48% |
-3.25% |
|
NOVEMBER |
0.51% |
1.68% |
1.32% |
-2.62% |
|
DECEMBER |
-0.58% |
0.22% |
0.92% |
-0.95% |
Source: CurrenciesFx.com, George Protonotarios
If we take a close look at the above table, we can conclude that the average monthly returns of these four (4) asset classes do not follow a particular pattern. On the contrary, there is a random distribution of monthly returns between these (4) major asset classes. For example, January and November are traditionally good months for both the US Dollar and the Gold price. This is an anomaly as the price of Gold is priced in US Dollars, and that means USD and Gold must trade in opposite directions. It seems that during a very long period (15.5 years in our research) each asset class follows a different cycle based on its fundamental landscape.
■ During a long period, each asset class follows a different price pattern based on each own fundamental cycle
Intermarket Analysis Conclusions
After the crisis of 2007, the interconnections between global financial markets are stronger than ever. Consequently, Intermarket Analysis is more valuable than ever for an investor, to obtain early insight regarding long-term trends. The key to Intermarket analysis is the US Dollar, as the USD affects directly every other financial asset in our financial universe. The US Dollar has shown a purely adverse correlation to commodity prices, but investigating the USD's relation to equity and bond prices is a much more complex process. Nevertheless, in a normal inflationary environment, equities, bonds, and the USD are positively correlated to each other. Commodities should trade in the opposite direction than bonds, equities, and especially against the USD.
Note, that there might be periods when the Intermarket relationships will not work. These periods may last from a few weeks to several months. The common reasons behind such anomalies are (i) political changes that affect the macroeconomic environment, (ii) a major financial crisis, such as the US real-estate bubble of 2006-2007, or the European Crisis that followed after.
In addition, it seems that during a very long period, each asset class follows a different long-term pattern based on its fundamental landscape. According to our research (15.5 years of data), the average monthly returns of four (4) major assets (USDX, US30, Gold, and Crude Oil) follow different patterns.
As concerns the Intermarket relations between different asset classes, there are some key findings:
■ AUDUSD has shown a 0.80 positive correlation to Gold
■ USDCAD has shown a 0.75-0.80 negative correlation to Crude Oil
■ USDJPY has shown a generally positive correlation with US equity markets
■ EURUSD has shown a positive correlation to GBPUSD
■ Industrial Metals have shown a positive correlation to global economic growth
■ Changes in the spread between the 10-year and 30-year bond yields can provide insight into future economic conditions
In a broader view, Intermarket Relationships do work and can prove an essential tool for more accurate forecasting, but also the minimization of portfolio risk deriving from all these correlations.
■ Intermarket Forex Analysis
George Protonotarios, Financial Analyst | » George at Linkedin
CurrenciesFx.com (c)
> READ MORE ON MACRO


