 Key Cross-Asset Correlations
A cross-asset correlation measures the degree to which the price of a financial instrument is affected by a change in the price of another instrument of a different asset class.
Introduction to Cross-Asset Correlations
The globalization of the economy and the unification of the world financial markets into a common area of investment opportunities are the drivers of the increased cross-asset correlations we have witnessed over the past 20 years.
Defining Correlation:
In general, a correlation between two variables expresses an average relationship that is backed by historical data. The correlation coefficient receives values between -1.0 and +1.0, and that means:
-
+1.0 is the perfect correlation reflecting identical movements/directions
-
-1.0 is the perfect negative coefficient reflecting identical opposite directions
What is a Cross-Asset Correlation?
A cross-asset correlation is a relationship between two instruments belonging to different asset classes. After the global financial crisis of 2008, there is a significant increase in cross-asset correlations between equities, Forex currencies, commodities, credit, and interest-rate products.
Uncertainty Enforces the Correlation Effect
When the macro outlook changes dramatically, the financial markets tend to adjust rapidly their risk/return combinations seeking a new balance. Moreover, increased cross-asset correlations appear between Currencies, Gold, Energy prices, Credit, and Equities.
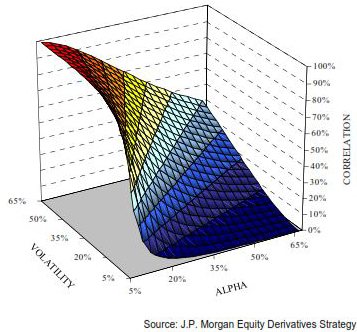
During periods of macro uncertainty, investors tend to see equities, soft commodities, energies, and corporate bonds as sources of unwanted portfolio risk. Hence, they sell simultaneously all these asset classes. The price of these asset classes moves consequently in sync. This phenomenon creates an increased relationship between macro uncertainty, volatility, and cross-market correlations. In the following chart by JP Morgan, we can see exactly how increased volatility results in high cross-market correlations.
Chart: The relation between Volatility, Alpha, and Cross-Market Correlations

These are some basic conclusions:
□ More VOLATILITY (↑) → More Correlation (↑)
□ Less VOLATILITY (↓) → Less Correlation (↓)
□ More ALPHA (↑) →Less Correlation (↓)
□ Less ALPHA (↓) → More Correlation (↑)
Key Cross-Asset Correlations
These are the key correlations between different asset classes:
(1) Forex Currencies
There is a strong correlation between Forex currencies and equities. This correlation is enhanced by Carry trading, Trading on Margin, and Cross-Asset Arbitrage. The strongest Forex/Equity correlation exists between USJPY and the US equity markets. When the risk appetite for buying stocks increases then investors usually borrow money in Japanese yen to buy these stocks. That is happening as the Japanese Yen offers traditionally very low borrowing rates. The result is that when equities go up the US Dollar against the Japanese Yen goes up too.
■ US Equity Indices are directly correlated to USDJPY
□ More about USDJPY and Stock Indices Correlation: http://forexexperts.net/index.php/trade-strategy/forex-correlations/correlation-usdjpy
Before the financial crisis of 2007-2008, there was a highly negative correlation between equities and the US Dollar. After 2008, things got more complicated.
(2) Equities
As we said before, financial markets operate nowadays as a common area of investment opportunities offering different Risk/Return combinations. The Equity Markets are highly correlated to almost all other major financial markets. There is a high correlation to Government Bonds and Credit Products, but also to several Forex pairs (USDJPY, USDCHF, etc.).
As it was explained before, macro volatility can be the key driver of increased equity market correlations. Take for example a period when investors fear the prospect of global economic growth. They will sell equities but at the same time, they will sell Corporate Bonds, and go short on Crude Oil as the demand for energy will consequently decrease.
In another example, when Foreign investors buy aggressively equity assets the domestic currency will consequently appreciate as an effect of the increased capital inflows.
(3) Interest Rates and Government Bonds
The level of interest rates is the core of any investment decision regarding currencies, equities, bonds, etc. Any modification in the level of interest rates can change dramatically the Risk/Return combinations of all financial instruments.
During periods of financial turmoils, investors become risk-averse and thus they tend to sell equities to buy government bonds. There is a strong correlation between USDCHF and the Yield of US Bonds. Note that the yield and the price of a government bond are negatively correlated, and therefore:
■ USDCHF is directly correlated to US Bond Yields
■ USDCHF is inversely correlated to US Bond Prices
□ More about the Correlation of US Bonds Yields to USDCHF: http://forexexperts.net/index.php/trade-strategy/forex-correlations/us-bonds-yields
(4) Commodities
The implementation of portfolio diversification techniques during the past 20 years resulted in a major investment appetite for commodities. Commodities are highly correlated to both currencies and equities. The currency rate of major commodity exporters is highly influenced by fluctuations in the commodity markets. For example, the Australian Dollar is highly correlated to gold as Australia is the world's largest gold exporter.
■ AUDUSD has had an 80% historical correlation to the Gold Price
□ More about the Correlation of Gold to AUDUSD: http://forexexperts.net/index.php/trade-strategy/forex-correlations/audusd-gold-correlation
In addition, several currencies are correlated to Crude Oil, for example, the Canadian Dollar, the Norwegian Krone, and the Russian Ruble.
■ CADUSD and Oil Price 0.75-0.80 positive correlation
■ CADJPY and Oil Price 0.80 positive correlation
Before the financial crisis of 2007-2008, commodity prices were negatively correlated to equities and government bonds, and they were even weakly correlated among themselves. After 2008, the correlation between commodities and equities turned positive. That is especially true as concerns the Oil/Equities correlation. As JP Morgan supports in a 2011 report on cross-asset correlation “About 40% of current commodity/equity correlation is a spillover from FX/equity correlation”.
The commodity prices, in general, are negatively correlated to the US Dollar. The reason is that commodities are priced in US Dollars.
(5) Credit Products
Credit and Equities are highly correlated (80%) among themselves. This correlation is based mainly on:
(i) capital structure arbitrage, but also on
(ii) hedging techniques on credit products by using equity instruments.
Trading Cross-Asset Correlations
Straddle Techniques to trade cross-asset correlations
Cross-asset correlations can be traded using Straddle Techniques after performing a detailed Correlation Study. Here is the basic mechanism behind a cross-asset straddle trade:
(1) An investor spots a considerable price divergence between two high-correlated assets
(2) he sells the asset that trades statistically higher and at the same time
(3) he buys the asset that trades statistically lower (an equivalent position)
This straddle technique is more effective when there is a considerable gap between the two correlated assets and when the cross-asset correlation is above 0.75.
These are some interesting cross-market negative correlations that can be traded using a straddle strategy:
- Crude Oil against JPY/CAD
- Crude Oil against USD/CAD
- Gold against the USDX (US Dollar Index)
- Gold against the USD/AUD (inversing AUD/USD)
- US Bonds Prices against the USD/CHF
- S&P 500 against the 30-Year Treasury Bond
■ Cross-Asset Correlations
CurrenciesFx.com (c)
> READ MORE ON RESEARCH


