 Foreign Exchange Market Volumes
Volume is a leading market indicator that can help traders to recognize strong trends and reversals, but also to identify the current market phase and to think ahead of the current price action.
In general, analyzing market volumes can be helpful in:
-
Evaluating the strength of a price trend
-
Confirming the breakout of a key support/resistance level
-
Recognizing the market phases of accumulation/distribution
-
Indicating signs of potential price reversal
-
Optimizing the time to enter/exit the market
The Aggregate Forex Market Volumes
All organized exchanges report daily the aggregate number of traded financial assets (contracts, shares, etc.). On the contrary, the Foreign Exchange market is an OTC (Over-the-Exchange) decentralized market and that means measuring the aggregate volumes is a very difficult task. The Bank of International Settlements (BIS) offers some insight regarding Foreign Exchange volumes.
Here are some key points according to the BIS Triennial Survey (2016):
-
The Foreign Exchange market's daily volumes average over 5.0 trillion USD
-
Spot transactions reach 1.7 trillion USD per day (diminishing for the first time since 2001)
-
FX swaps transactions reach 2.4 trillion USD per day (Forex traders are showing an increasing interest in derivatives contracts)
-
Outright Forwards reach 0.7 trillion USD per day
-
Options and Similar products reach 0.25 trillion USD per day
-
The US dollar remains the dominant vehicle currency, being on one side of 88% of all Forex transactions (Euro 31%)
-
Five countries (UK, USA, Singapore, Hong Kong, and Japan) contribute 77% of all Foreign Exchange transactions
Source: https://www.bis.org/bispapers/index.htm?m=162
Forex Market Sessions and Volume
The London Session is traditionally the most active Forex session and the New York session is the second most active. The London/New York session overlap offers the most volume-active Forex trading hours.
■ Volume peaks between 12.00 GMT and 16.00 GMT
» Forex Market Hours and Trading Sessions
Using Trading Volumes to Trade Forex
As mentioned before, measuring Forex market volumes is a difficult task. These are some alternative methods of measuring and analyzing Forex Market volumes.
Measuring the Number of Ticks to Calculate Forex Volumes
Measuring the tick data can provide useful insight into the intensity of trading volumes. The tick volume measures the number of tick changes for a given period. The theory is that as more price movements (ticks) occur more trading volume occurs. When trading using the MT4, the volume is a tick counter. Practically, if one tick equals one volume, as the tick moves up and down the volume figures are rising too.
In 2011, Caspar Marney, the head of Marney Capital, analyzed the correlation of tick volume to actual trading volume. As the source of trading volumes, he used data from EBS, eSignal, and Hotspot. According to Caspar Marney, the correlation between tick volume and actual volume is over 90% (source: MoneyShow.com).
■ taking advantage of the correlation of tick volumes to actual volumes
■ 1 tick = 1 volume
■ if the number of ticks is rising, the trading volume is increasing
Using Market Volumes to Recognize Price Waves
The market volumes can provide a hint as to if the price of financial assets trends or accumulates. The price of financial assets tends to move in certain waves (upward/downward). Each wave evolves in three phases:
-
Main price movement –or trend (↑↓)
-
Correction –or else profit-taking (↓↑)
-
Accumulation/Distribution –until the next wave begins
By analyzing volumes, traders can recognize each phase and improve their entrance/exit in the market. Normally, the market volumes will peak as the price peaks and accumulate as the price accumulates.
Using Volumes to Detect Accumulation/Distribution
Defining accumulation and distribution:
□ Accumulation refers to a market phase where buyers are stronger than sellers, and the price is expected to rise soon. During an accumulation period:
(a) The volume increases and the price moves higher
(b) The price can hardly close down
□ Distribution refers to a market phase where sellers are stronger than buyers, and the price is expected to drop soon. During a distribution period:
(a) The volume increases and the price moves lower
(b) The price can hardly close up
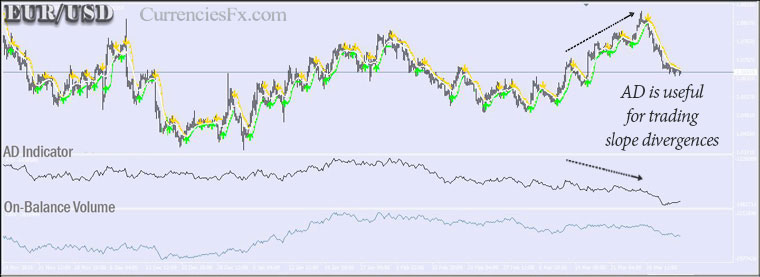
AD (Accumulation/Distribution) Indicator
The Accumulation/Distribution is a momentum indicator that measures the accumulation/distribution balance using price and volume.
■ AD = {(Close Price – Open Price) / (High Price – Low Price)} x Volume
Explanation:
-If the AD is moving higher, it indicates that the demand is stronger than supply (accumulation prevails)
-If the AD is moving lower, it indicates that the supply is stronger than demand (distribution prevails)
-The higher the volumes, the more noticeable the AD changes will be
Accumulation/Distribution Divergences
Most commonly, the price moves in the same direction as AD. Any divergences between the price slope and AD slope can signify changes regarding the trend direction (reversals).
-
Buying signal when there is a bullish divergence
-
Selling signal when there is a bearish divergence
Other Money Flow (Volume) Indicators
Money flow indicators are not stand-alone tools. These tools can be used along with pure price oscillators, such as MACD, Stochastics, and RSI. The Accumulation/Distribution Indicator and the following indicators are included in all modern trading platforms (MT4, MT5, etc.).
On Balance Volume (OBV)
The On-Balance-Volume (OBV) was developed by Joe Granville in his 1963 book “Granville's New Key to Stock Market Profits”. The tool can detect whether the trading volume is bullish or bearish, and it can detect also price accumulation phases.
-Volume is added if the market ends higher and subtracted if the market ends lower
-OBV can show price divergences

Chaikin Money Flow (CMF)
Chaikin Money Flow (CMF) is an indicator that measures money flow volumes over some time. The CMF is used as a short-term oscillator, but it can also be used for detecting divergences.
-It focuses on extended volumes when prices end higher or lower than their daily range
-Values are positive if the price closes in the upper level of the range and negative if the price closes in the lower level of the range.
-It provides a measure of the corresponding strength
-It can show price divergences
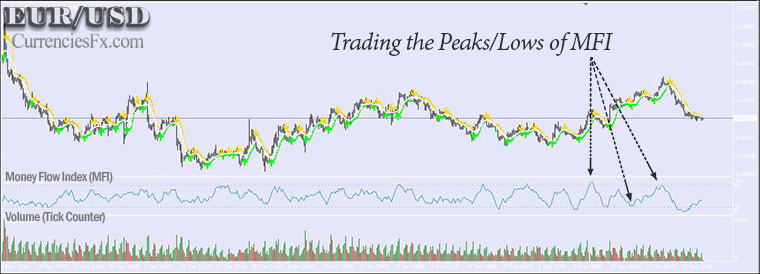
Money Flow Index (MFI)
Developed by Colin Twiggs, the Money Flow Index is an enhancement of the Chaikin Money Flow Index. The Money Flow Index is a volume-weighted version of the popular RSI. The MFI measures the rate at which money flows in or out of a market. The interpretation of MFI is identical to RSI.
(i) MFI operates within a range between 0 and 100, as RSI
(ii) Money Flow Index readings below 20 indicate a potential oversold market, and MFI readings above 80 indicate a potential overbought market
(iii) As in the case of RSI, potential divergences between the indicator and price can highlight price reversals.

Calculating the Money Flow Index
1. TypicalPrice = (High + Low + Close) / 3
2. MoneyFlow = TypicalPrice x Volume
3. MoneyRatio = Sum(MoneyFlow+) / Sum(MoneyFlow-)
4. MFI = 100 – {100 / (1 + MoneyRatio)}
If the current typical price is higher than the previous typical price, the Money Flow is positive. If the current typical price is lower than that of the previous, the Money Flow is negative.
-
MF – Money Flow Positive (MF+), if current TypicalPrice > previous TypicalPrice
-
MF – Money Flow, {negative (MF-) otherwise), if current TypicalPrice < previous TypicalPrice
A Few Words about Richard D. Wyckoff and its Volume Spread Analysis (VSA)
Richard D Wyckoff (1873-1934) introduced Volume Spread Analysis (VSA) during the 1920s. Many famous traders used VSA including JP Morgan and Jesse Livermore. According to Wyckoff, measuring demand & supply through price and volume is the key to predicting future market movements. The VSA method focuses on measuring:
-
Accumulation / Distribution
-
Price / Volume Correlation
The Three Laws of the Wyckoff Method
(1) The Law of Supply and Demand
(2) The Law of Cause and Effect
(3) The Law of Effort vs Results
The Five (5) Steps of Richard Wyckoff's Method
(1) Determine the current trend and the current position of the market
(2) Follow the trend by determining relative strengths or weaknesses
(3) Select trades with a cause significant enough to produce a satisfactory effect (profit)
(4) Evaluate the readiness of an asset to respond immediately to its cause
(5) Time your trades to anticipate movements
The modern Volume Spread Analysis analyzes the current price action by focusing on the relationship between price, price range, and volume. The VSA method is the ideal tool for detecting imbalances between Supply and Demand, which can lead to strong trends or reversals.
Basic Conclusions Regarding Forex Market Volumes
Measuring volume is certainly a useful practice when trading in any financial market. It can show market strengths or weaknesses, as well as strong trends and price reversals.
-
Volume can show the strength and the health of a price movement
-
Volume can signify the end of an accumulation/distribution period
-
Without significant volume, a price peak or a price drop is probably a momentary movement without meaning
-
When the price breaks through an important support/resistance level with significant volumes, it is a sign of strong momentum
-
When the price is incapable of breaking an important support/resistance level and the volume peaks, it is a general sign of trend reversal
-
Large volumes signal a large number of market participants and usually the existence of more institutional investors
There are many available volume indicators, including the On-Balance-Volume and Money Flow Index. Money-flow oscillators are not stand-alone tools. These indicators can either confirm the signals of pure oscillators such as MACD or RSI or highlight price divergences and reversals.
■ Analyzing Forex Market Volumes
George Protonotarios, financial analyst
CurrenciesFx.com (c) 2016
> READ MORE ON RESEARCH


