 How to Trade with Bollinger Bands
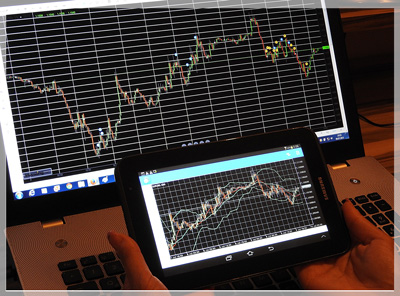
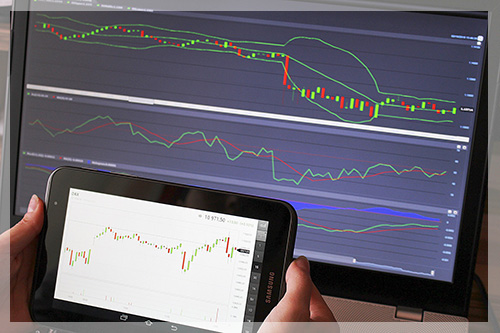
Technical analysis is considered an essential tool for succeeding in Forex trading. One well-used indicator often used to measure volatility is Bollinger Bands. This was a tool invented by a well-known technical trader, John Bollinger in the 1980s, whereby two Bollinger bands, the price of the currency, and a simple moving average are plotted onto a chart. An upper and low band are placed two standard deviations away from the moving average.
The chart easily displays trends; widening bands show high volatility whereas contracting bands indicate low volatility. When the bands squeeze the moving average, traders in the future will expect increased volatility and opportunities to enter the market. In a vice-versa scenario, when the bands are widening traders would expect lower volatility and opportunities to exit the market.
Traders tracking price movements have concluded that when close to the upper or lower band the market is overbought or oversold. The bands can be used as support (upper boundary) and resistance (lower boundary) lines signaling when to enter and leave a market. Most price action occurs within the two bands; only in extenuating circumstances such as a major event will a breakout occur.

