 How to Trade with Bollinger Bands
Technical analysis is considered an essential tool for succeeding in Forex trading. One well-used indicator often used to measure volatility is Bollinger Bands. This was a tool invented by a well-known technical trader, John Bollinger in the 1980s, whereby two Bollinger bands, the price of the currency, and a simple moving average are plotted onto a chart. An upper and low band are placed two standard deviations away from the moving average.
The chart easily displays trends; widening bands show high volatility whereas contracting bands indicate low volatility. When the bands squeeze the moving average, traders in the future will expect increased volatility and opportunities to enter the market. In a vice-versa scenario, when the bands are widening traders would expect lower volatility and opportunities to exit the market.
Traders tracking price movements have concluded that when close to the upper or lower band the market is overbought or oversold. The bands can be used as support (upper boundary) and resistance (lower boundary) lines signaling when to enter and leave a market. Most price action occurs within the two bands; only in extenuating circumstances such as a major event will a breakout occur.
How to Use Bollinger Bands
Bollinger Bands are an accurate measure of the market’s performance its focus on volatility keeps the indicator adjusting to market conditions. In addition, traders trawling through price data only need to look within its two bands. Furthermore, this indicator can be applied to virtually any security or market.
As useful as the data is even John Bollinger, the architect of Bollinger Bands, advises that the indicator should be used in conjunction with others to find more direct market signals. Most standard charting packages will include a Bollinger band indicator. However, some charting packages, such as MT4’s charting package, are notably superior to others.
◙ Performance:
- Measure Market Volatility
- Identify Reversals
- Identify Early-Triggers
- Evaluate Oversold/Overbought Market Levels
◙ MT4 Settings:
- 20 Periods Simple Moving Average | 2 Standard Deviations
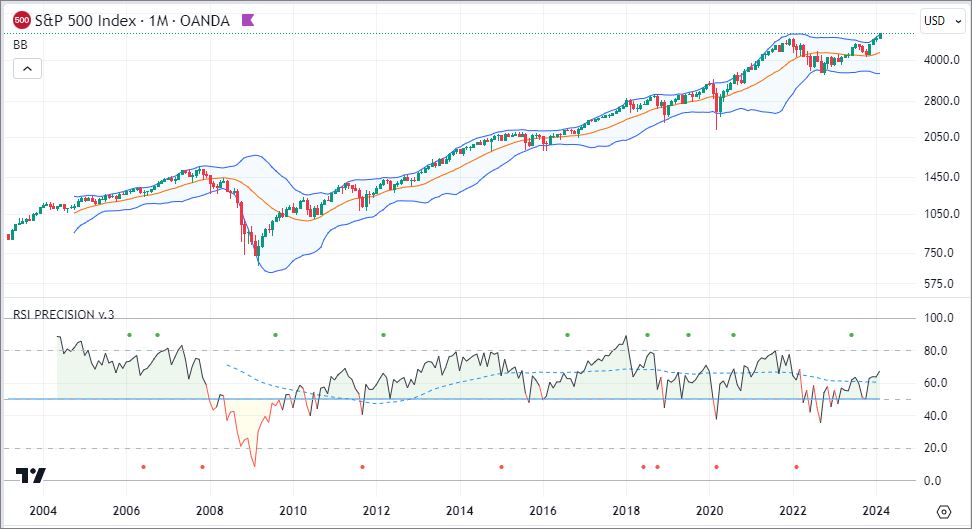
On the following monthly S&P500 chart, Bollinger Bands and RSI Precision.
Image: Bollinger Bands & RSI Precision on S&P500

Bollinger Bands Calculation
Here is how each of the three bands is calculated:
■ Upper Band = 20-day Simple Moving Average + (20-day Standard Deviation of Price x 2)
■ Middle Band = 20-day Simple Moving Average
■ Lower Band = 20-day Simple Moving Average - (20-day Standard Deviation of Price x 2)
Calculating the %b {Default setting (5,1)}
■ %b = (Price ‐ Lower Band) / (Upper Band ‐ Lower Band)
■ A Quick Guide to Bollinger Bands
CurrenciesFx Blog (2018)
> READ MORE ON CURRENCIES FX
□ INFORMATION
» Opening a Forex Trading Account (FAQ)
» Forex Signal Services
» Algorithmic or Forex Trading
» ECN/STP Fx Brokers

