 The VIX or else the "S&P500 Fear Index” is a market thermometer measuring the risk appetite of equity investors. The VIX is a contrarian indicator that can help identify extreme market movements and potential reversals.
Introduction to the VIX Index
The Volatility Index or else the VIX Index of the Chicago Board of Exchange (CBOE) indicates the expected volatility of the S&P 500 Index Options. In other words, it predicts the future volatility of the S&P 500 stock index. The Chicago Board of Exchange introduced the VIX Index in 1993 but added a VIX futures contract, not before 2004.
The VIX index measures the level of fear or greed in the stock market. In general, investors trade the VIX for hedging and speculation:
-
Hedging against the volatility risk of their existing S&P 500 positions, as historically, the VIX Index is negatively correlated to equity prices
-
Speculation on potential VIX volatility movements
Large institutional investors use the VIX derivatives to hedge their long positions in S&P 500 stocks. This is happening as the market volatility booms when the stock prices tank. Other investors simply use the VIX Index to speculate on high S&P 500 volatility.
What Does the VIX Measure?
As calculated by the CBOE, the VIX presents the market expectations concerning S&P 500 volatility for the next 30 days.
■ VIX tracks CBOE put (down) and call (up) options of the S&P 500
■ VIX above 30 indicates high volatility and below 20 indicates low volatility
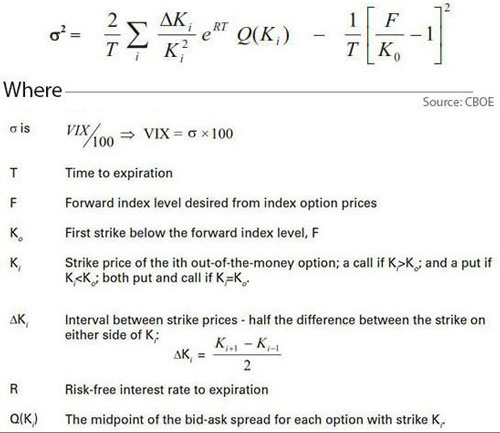
The VIX Formula
This is the generalized CBOE VIX Index formula:

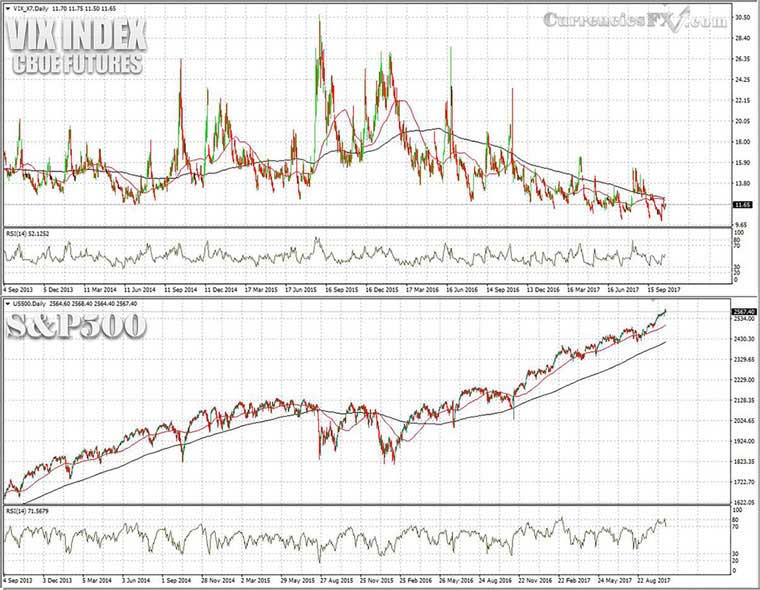
VIX and S&P500 Chart
The following chart presents the Daily S&P 500 and VIX for the period September 2013 to September 2017. We have added two moving averages on both charts: {Blue line is MA(200) and Red Line is MA(50)}
Chart: Daily VIX and S&P500

Observations for VIX:
1. When the S&P500 surges the VIX Index moves lower, and vice versa
2. VIX above the level 30 indicates high volatility
3. VIX below the level 20 indicates low volatility, and note that VIX can stay in the levels 10-20 for a long time before spiking
4. The 50-day EMA and the 200-day EMA act as support and resistance for the VIX
5. VIX tends to find support or resistance near prior highs and lows and around big round numbers (20, 30, or 50)
6. VIX is sensitive to seasonality effects, as volatility tends to increase during some months of the year (traditionally, the most volatile months for the US equity markets are October and January)
7. VIX is sensitive to S&P 500 options expiration cycle
Using the Bollinger Bands to Identify VIX Extreme Movements
By adding the Bollinger Bands to a Daily VIX chart, we can create a simple indicator of future VIX returns. The Bollinger Bands are driven by volatility and can prove helpful in identifying extreme price movements and possible reversals. In our example, instead of the standard 20-period MA of the Bollinger Bands, we use the 10-period MA.
Observations:
-
When the VIX moves above the MA (10), which is the middle line of the Bollinger Bands, it is highly probable that will move further up
-
When the VIX moves below the MA (10), which is the middle line of the Bollinger Bands, it is highly probable that will move further down
-
When the VIX moves above the Upper Bollinger Band, or below the Lower Bollinger Band, it is a sign of an upcoming reversal
Convergences and Divergences between VIX, S&P500, and Nasdaq
Convergences or divergences between the futures of the S&P500, the futures of the Nasdaq, and the VIX Index can forecast the investor’s appetite for risk. Note that the following analysis is based on the assumption that the S&P 500 Futures and the Nasdaq futures are moving in the same direction.
-
When the S&P 500 and Nasdaq rise (↑) and at the same time the VIX rises or falls (↓) it is a sign of a bullish convergence that may lead the stock market to continue rising (↑)
-
When the S&P 500 and Nasdaq rise (↑) and at the same time the VIX rises (↑) it is a sign of a bearish divergence that may lead to a bearish reversal (↓) in the stock market
-
When the S&P 500 and Nasdaq fall (↓) and at the same time the VIX rises (↑) it is a sign of a bearish divergence that may lead the stock market to continue falling (↓)
-
When the S&P 500 and Nasdaq fall (↓) and at the same time the VIX falls (↓) it is a sign of a bullish divergence that may lead to a bullish reversal (↑) in the stock market
|
S&P 500 |
NASDAQ |
VIX |
S&P 500 PREDICTION |
|
rise (↑) |
fall (↓) |
(-) |
No Indication |
|
fall (↓) |
rise (↑) |
(-) |
No Indication |
|
rise (↑) |
rise (↑) |
fall (↓) |
Continue Rising (↑) |
|
rise (↑) |
rise (↑) |
rise (↑) |
Bearish divergence (↓) |
|
fall (↓) |
fall (↓) |
fall (↓) |
Bullish divergence (↑) |
|
fall (↓) |
fall (↓) |
rise (↑) |
Continue Falling (↓) |

Trading the VIX via CFDs
VIX is not an asset itself, as the VIX Index emerges from the prices of the S&P500 index options. Therefore, when you are trading the VIX, you are trading the S&P500. To trade the VIX, you need to trade its derivatives (CFDs, Futures, Options, or ETFs).
If you trade VIX Futures or CFDs, you will notice that the spread between ask & bid is usually wide. In that case, avoid entering market orders and prefer to use limit orders
LINKS
■ Volatility Indexes (Stock Indexes)
-
Volatility Index VIX: » www.cboe.com/VIX | Skew Index: » www.cboe.com/Skew
■ Trading the VIX
G. P. for CurrenciesFx.com (c) 2017
> READ MORE
□ INFORMATION
» Getting Started with Trading Resources
» Forex Signal Services
» Other Financial Markets
□ EDUCATION
» Algorithmic or Mechanical Trading
» Forex News-Trading & Indicators
» Technical Analysis

